
Key takeaways
- Map the process as it runs on the unit, not as the policy describes it.
- Give every role its own lane so handoffs and waits between roles stand out.
- Add data to the map: time at each step, waiting time and where events cluster.
- Test future-state changes in small cycles and measure whether they hold.
What process mapping is
Process mapping draws how work actually flows through a clinical or operational process: each step, decision point and handoff, and where work waits. A good map shows the gap between how a process is meant to work and how it really runs, where variation enters and where handoffs are risky.
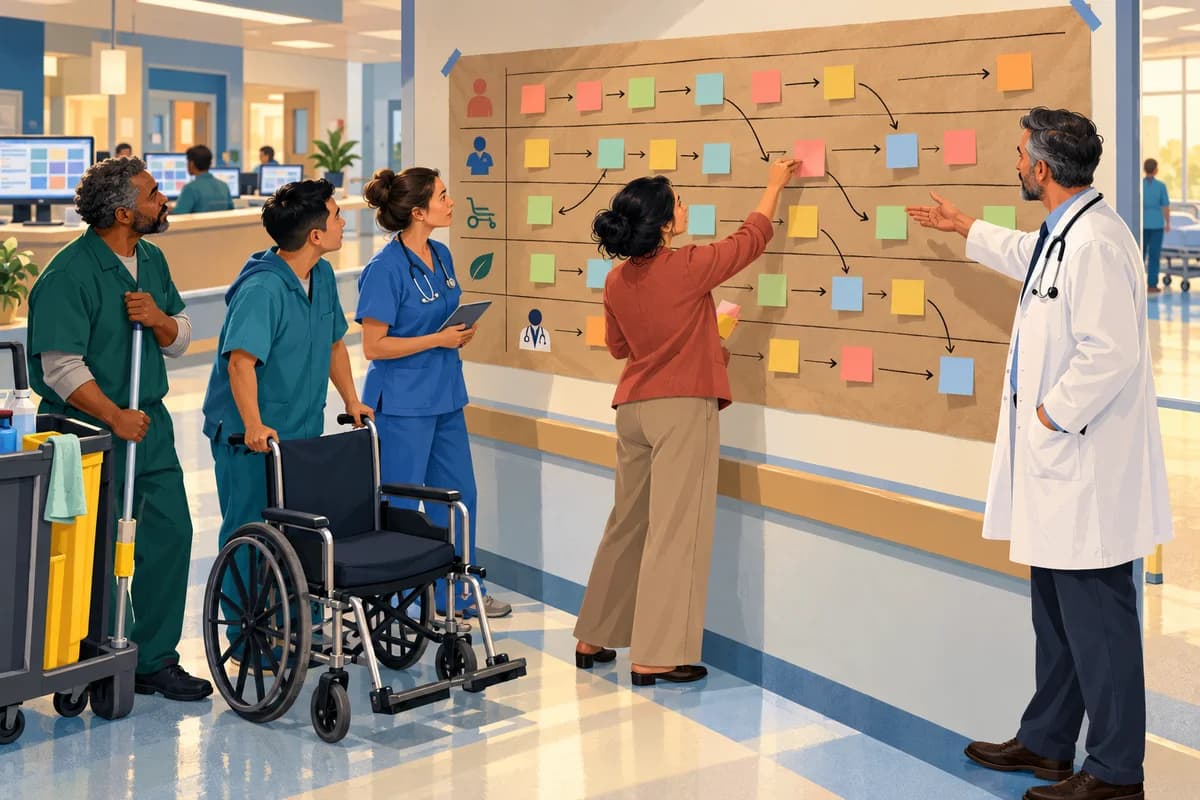
A swim lane diagram organizes the map into rows (lanes) by role, department or system, so every handoff between lanes is visible. That matters in healthcare because many failures happen at the boundaries between roles, such as physician to nurse, nurse to pharmacist and inpatient to outpatient, rather than inside one role's work.
Teams use process maps twice. The current-state map shows what happens today and where the problems are. The future-state map designs the improved process before anyone changes it. For flow and waiting time across a whole patient journey, a value stream map adds timing and wait data to the same idea.
When to use process mapping
Use process mapping when a team needs to understand a multi-step, multi-department process before analyzing its problems or redesigning it. It is especially valuable for care transitions (admission, discharge, transfer), complex protocols (rapid response, sepsis bundle) and any workflow with frequent, high-consequence handoffs.
It is usually an early step in an A3 or DMAIC project: the current-state map shows where problems occur and guides the root cause analysis, and the future-state map guides the countermeasures.

ImprovementFlow
Improvement Projects
Improvement Projects records the current state and the target state on a guided A3, so what a process map reveals turns into tested changes with measures attached and a follow-up review to see whether they held.
How to map a process with your team
- 1Define the start and end points and the one problem you are trying to understand, such as discharge delays.
- 2Invite someone from every role that touches the process, and give each role a lane.
- 3Walk the process, or replay a few recent real cases, and capture every step on sticky notes in the right lane.
- 4Mark decision points, handoffs between lanes and places where work waits for someone else.
- 5Add the data you have: time at each step, waiting time, and where events and complaints cluster.
- 6Agree the few biggest problems, then sketch a future state that removes waits, unnecessary handoffs and rework, and test it in small cycles.
Example: discharge delays on a medical-surgical unit
This is an illustrative example. A medical-surgical unit maps its discharge process to understand why patients often leave hours after the discharge order. Lanes include the attending physician, nurse, case manager, pharmacy, environmental services and transport, and frontline staff build the map over two sessions.
The map shows seven handoffs in a typical discharge and three points where everything stops: pharmacy can't start discharge medication reconciliation until nursing finishes a medication review, which can't start until the physician completes the discharge summary, which often isn't done until mid-afternoon even when the decision is made at morning rounds.
No single role could see this, because each saw only its own lane. The team redesigns two of the three bottlenecks so the work runs in parallel instead of in sequence, and tracks time from order to departure to see whether the change holds.
How ImprovementFlow supports this
- Process mapping is one of the analysis tools teams use in Improvement Projects, where the guided A3 records the current state and the target state side by side.
- Future-state changes are tested as PDSA experiments, each recorded with its predicted and actual effect.
- Linked metrics, such as discharge time, carry starting, current and goal values on the project, and follow-up reviews confirm whether the gains held.